This article shares experiences with Python drawing libraries that I was missing when I started. The primary audience are software engineers who are looking for the tool for simple graphics.
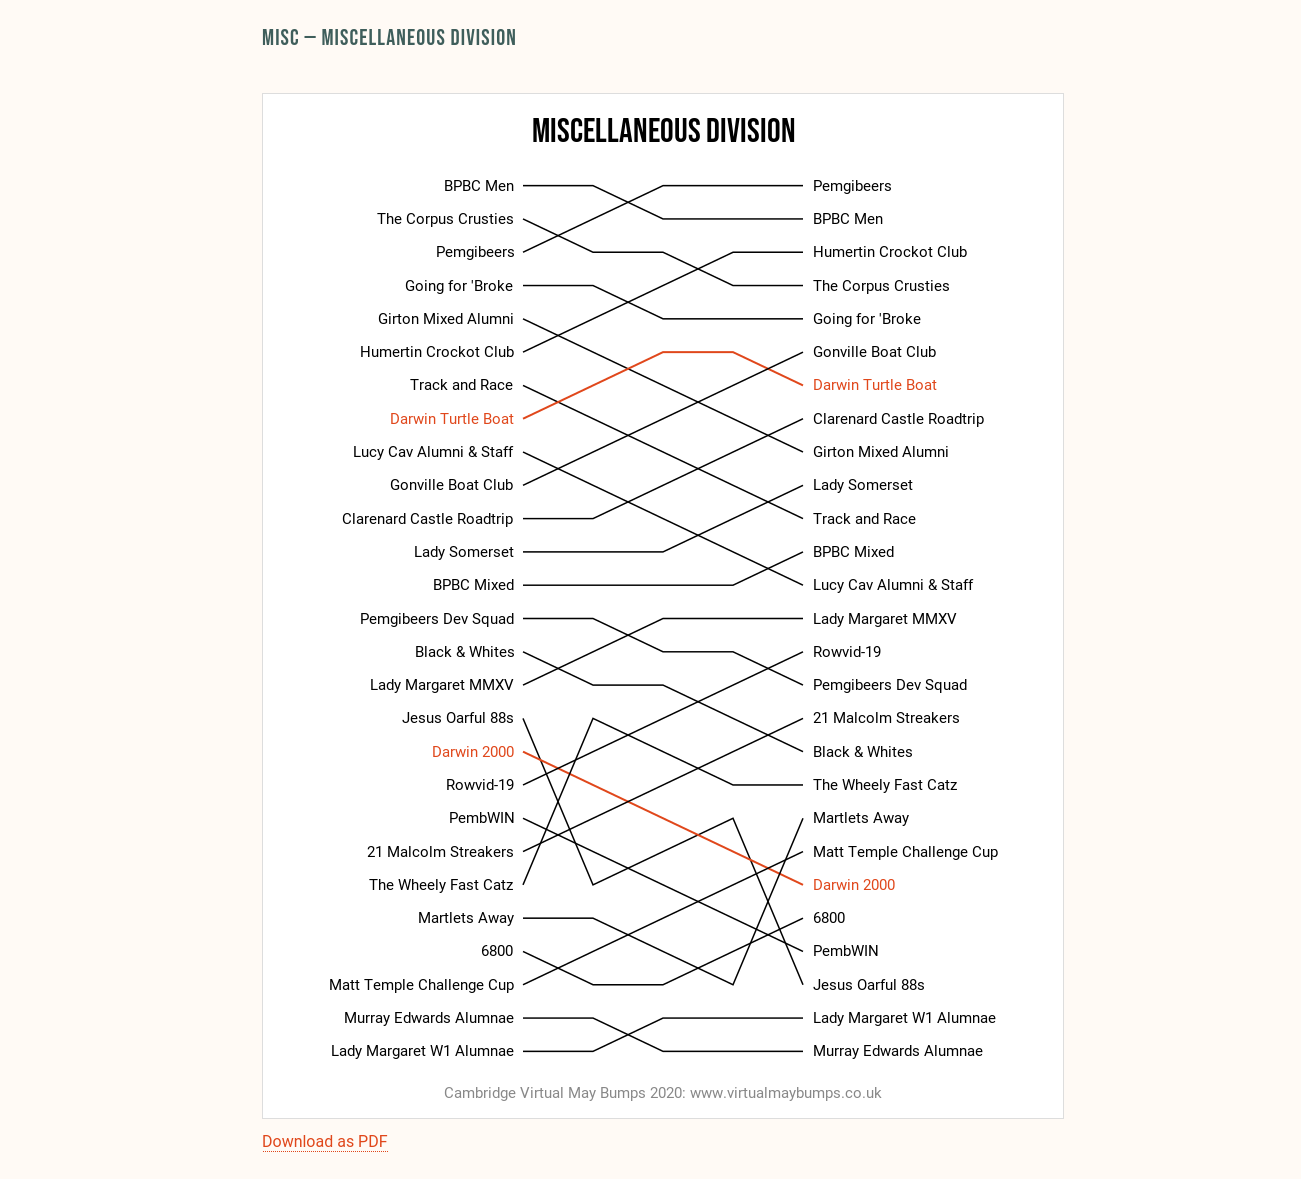
In 2020 the pandemic disrupted life. This included the cancellation of the traditional May Bumps rowing race that happens in Cambridge every year. Therefore, a group of rowing enthusiasts got together and organised a decentralized running event called Virtual May Bumps. It’s been a great success in bringing the community together (while being apart) and raising almost £6000 for charity.
The bump races are build around a total crew ordering that is visualised in a “bump chart”. It shows the relative positions as well as the “bumping events” where crews swap places. My task was to create such a bumps chart for our virtual running competition. Since the entire platform was implemented in Python, I decided to also do the image generation in it. During the implementation I hit some rough edges and limitations that I would have been helpful to know beforehand.
The website is now offline, but you can still see it on the Internet Archive Wayback Machine here.
Pillow
Many point to Pillow as the starter library for image manipulation in Python.
The library includes basic drawing operations in the ImageDraw module and it appeared to be a good choice for my simple charts.
However, Pillow is a general purpose image library that extends beyond simple drawing.
It can read various image formats, color management, screenshots, image filters, EXIF tags, and more.
My primary reason for choosing Pillow in the beginning was its good support for text.
The documentation on text drawing is well written and one can load custom fonts directly from .ttf files.
This made it easy to make the charts match the rest of the site.
from PIL import Image, ImageDraw, ImageFont

BLACK, WHITE = (0, 0, 0), (255, 255, 255)
FONT_DANCING = ImageFont.truetype("dancing_script_regular.ttf", size=36)

im = Image.new("RGB", size=(100, 100), color=WHITE)
draw = ImageDraw.Draw(im)
draw.text((50, 50), "Pillow", fill=BLACK, font=FONT_DANCING, anchor="mm")

im.save("pillow_text.png")
However, I quickly hit some limitations. The show stopper for me was the lack of support for anti-aliasing. Since bump charts have diagonal lines, the generated PNG looked very blocky. One workaround that I came up with was to use manual supersampling: I would drawing everything on a surface twice the size and then downscale it by 50%. However, this was inefficient and produced other artifacts. For example, lines of different angles appeared to have different width.
PyCairo
Initially, I was hesitant to look into PyCairo, because it was often described as very complex. However, it is in fact just as easy to use as Pillow. I think many consider it complex, because the official documentation comes with few ready-to-run examples. And sometimes the shown code solves the problem a bit too cleverly – outsmarting a beginner who tries to learn the basics. I found this Visual Documentation by Nicolas Seriot to be the best resource to get up to speed quickly. It’s in my personal hall-of-fame of outstanding documentation.
The feature list of PyCairo is almost endless (line joints, masks, gradients, …) and it supports anti-aliasing!
However, it is less ad-hoc than Pillow when it comes to text.
For starters, one cannot load a .ttf file directly.
Instead fonts must be first installed on the system before then referenced it by their name.
This makes bundling applications and deployments a bit more tricky since you will need an install step.
Also, there is no simple anchor parameter for aligning the text (e.g. centring).
Instead the application has to compute the parameters manually:
import cairo

surface = cairo.ImageSurface(cairo.FORMAT_ARGB32, 100, 100)
ctx = cairo.Context(surface)
ctx.set_source_rgb(0, 0, 0)
ctx.select_font_face("Roboto")
ctx.set_font_size(14)

def show_text_centred(ctx, x, y, text):
    x_bearing, y_bearing, t_width, t_height, _, _ = ctx.text_extents(text)
    ctx.move_to(x - x_bearing - t_width/2, y - y_bearing - t_height/2)
    ctx.show_text(text)

show_text_centred(ctx, 50, 50, "PyCairo")
surface.write_to_png("demo_pycairo.png")
Personally, I do not like PyCairo’s stateful context model where you modify the parameters in one step and then draw in the next one.
This makes refactors tricky, especially when rearranging the order of code.
An API that is more idiomatic in Python would be a very helpful thing to have.
However, it’s a common pattern in other languages as well (e.g. the Paint object in Java2D).
PyCairos architecture allows swapping the underlying surface between pixel and vector formats. This means, with PyCairo you can easily provide PDFs for high-quality prints:
with cairo.ImageSurface(cairo.FORMAT_ARGB32, 100, 100) as surface:
    your_draw_method(cairo.Context(surface))
    surface.write_to_png("demo_pycairo.png")

with cairo.PDFSurface("demo_pycairo.pdf", 100, 100) as surface:
    your_draw_method(cairo.Context(surface))
    surface.show_page()
    surface.finish()
PyCairo does not offer a method for directly returning bytes – which is what one would want for most web apps.
However, it is easy to solve this by using the io.BytesIO module:
def surface_to_png_bytes(surface):
    with BytesIO() as f:
        surface.write_to_png(f)
        return f.getvalue()
Alternatives
Since we are talking about charts here, we naturally have to talk about matplotlib as well.
It is very powerful, has default anti-aliasing, and supports fonts through its matplotlib.font_manager.
However, I considered it too complex for my use-case since I would still have to manually position elements and then translate its figure/axis objects to match my exact requirements.
It is of course a great choice for all proper chart plotting.
I use it extensively when doing research and visualising data on websites (e.g. VacTrend).
Conclusion
I think that PyCairo is the best choice for any half-serious drawing undertakings in Python – even for beginners. It is an example of a library that does one job, and does it very well. When working with the visual documentation, one can move just as quick as with the supposedly simpler Pillow library. More importantly, you won’t hit any important limitations as your project grows. The simple generation of PDF files is the cherry on top.
At the same time new libraries can learn from Pillow’s API and its use of the named method arguments – instead of the builder-like syntax inherited from C APIs. It certainly helps to maintain correctness as code evolves and is being shuffled around. Similarly, the dynamic typing of Python can be a great enabler for creative usage. In particular, allowing web developers to use hexcode strings directly for colours would be a massive time saver.
Credits: cover photo by Greg Rosenke on Unsplash.